DATA PLOT
This service allows to plot magnetograms from 27 observatories belonging to the BCMT network.
We recommend using 'Chrome' or 'Firefox' browser to get the best result.
To save the magnetograms, you can either 'print to a PDF file' or use a screen capture software.
 |
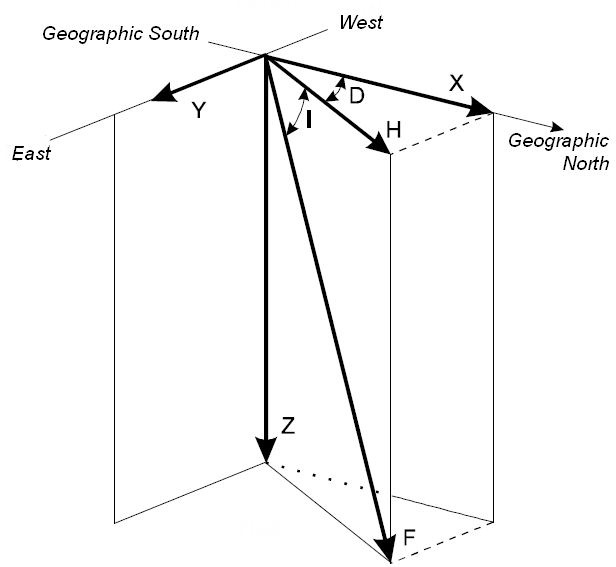
X Y E H D I Z F (= Fs) Fv Fv-Fs |
North-South component East-West component East-West component for variation data Horizontal field intensity Declination angle Inclination angle Vertical field intensity Total field intensity, scalar magnetometer Total field intensity, vector magnetometer Used as quality indicator |